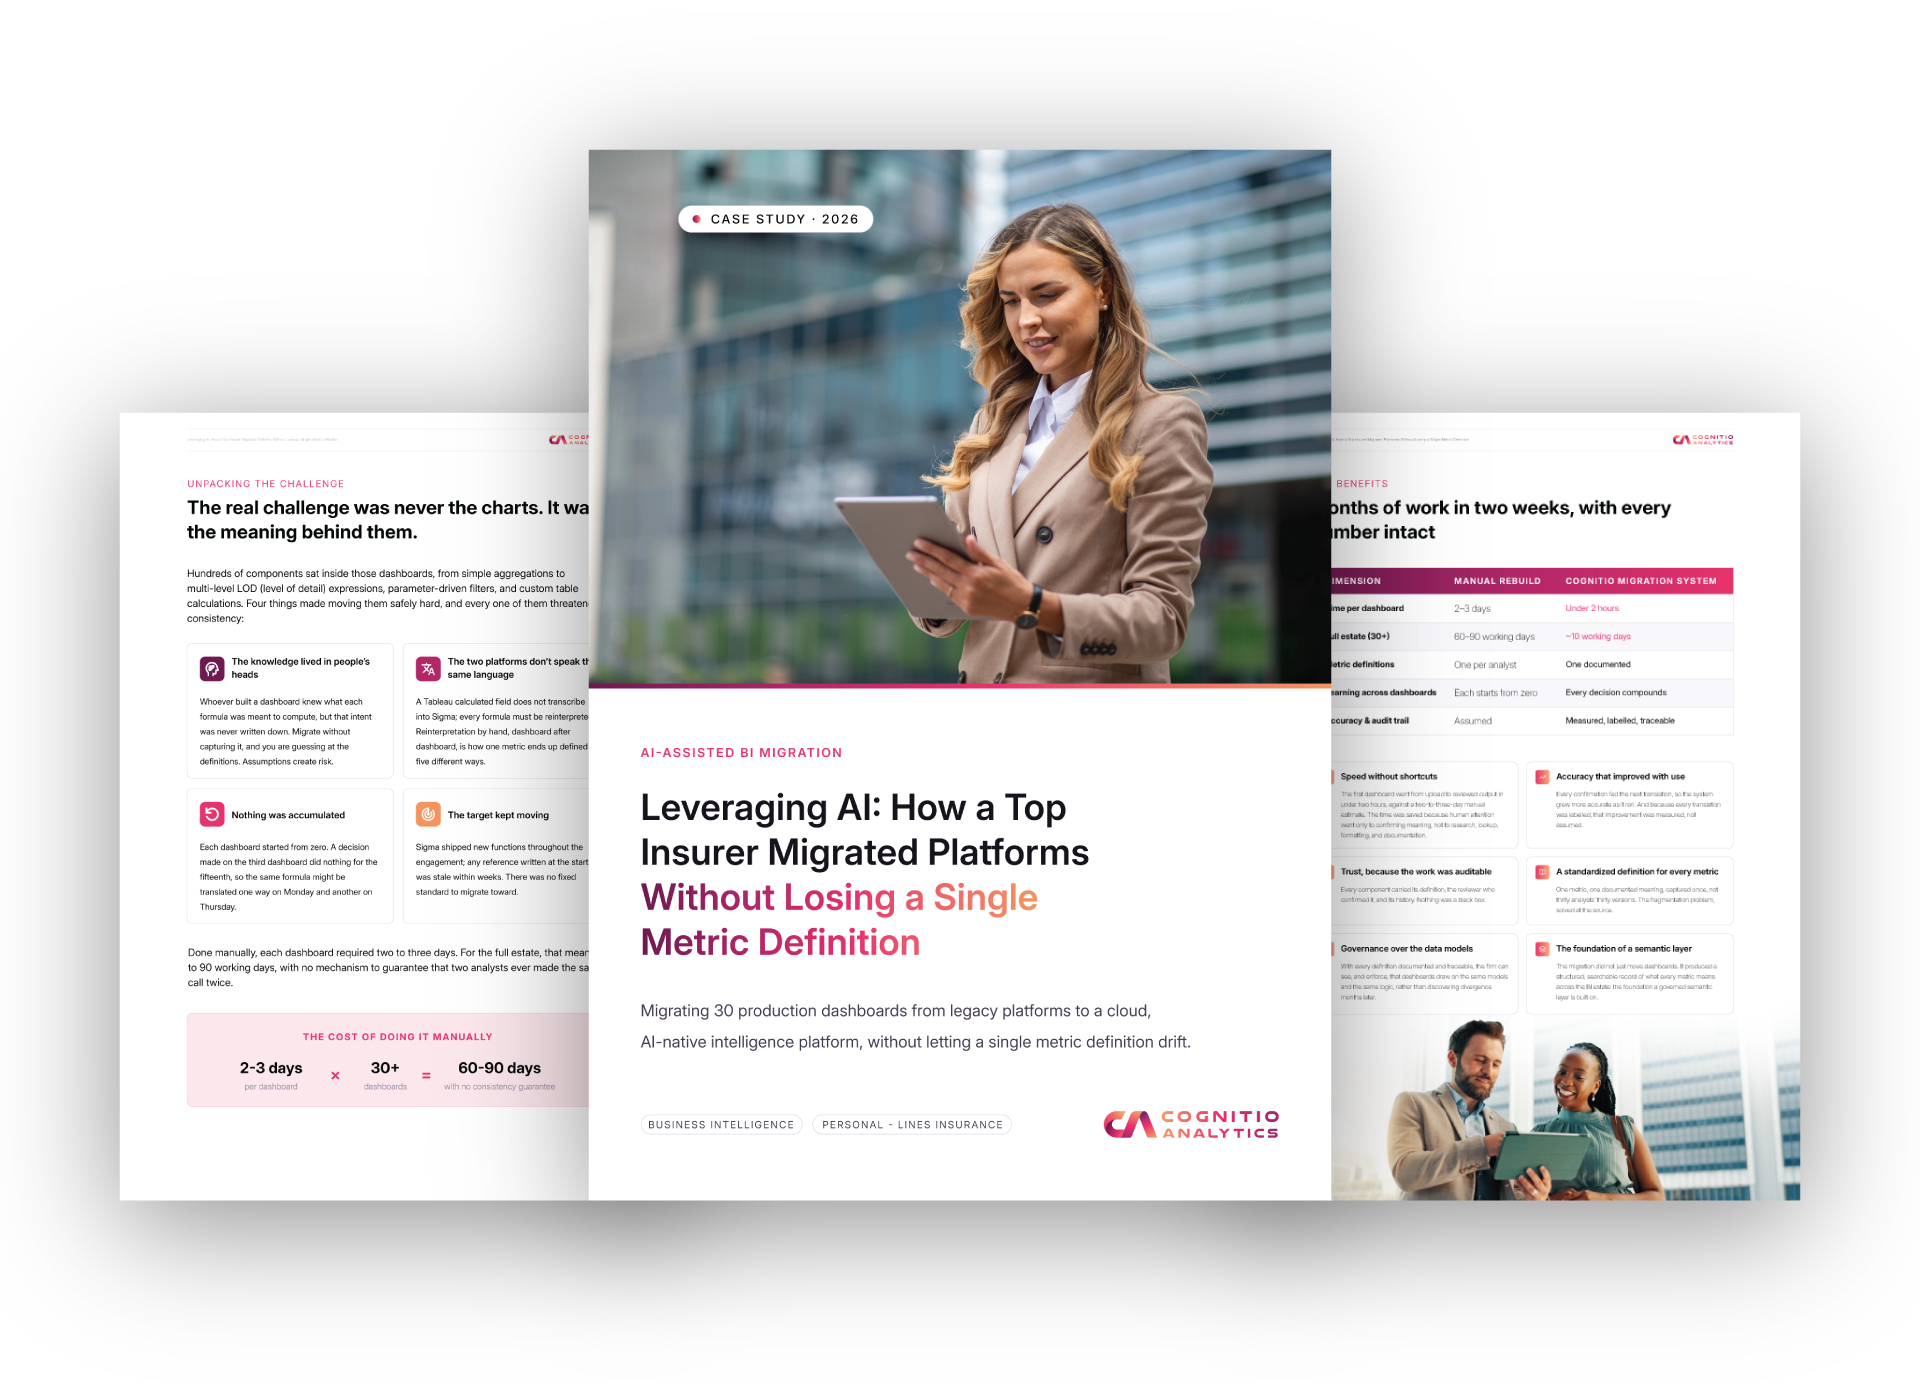
Leveraging AI: How a Top Insurer Migrated Platforms Without Losing a Single Metric Definition
A top US personal-lines insurer had chosen Sigma on Snowflake to modernize its analytics. The hard part was rebuilding 30+ Tableau dashboards without letting a single metric definition drift. Cognitio Analytics built an AI-assisted migration system, with the firm’s own experts in the loop, to translate, document and verify every component. The result: the full estate migrated in about 10 working days instead of 60 to 90. Download the case study to see how.
The Challenge
The Real Risk Was the Meaning Behind the Charts
Buying the platform was the easy part. More than 30 dashboards, with hundreds of components, still had to be rebuilt, and until they were, every real decision was still being made in Tableau. Rebuilt by hand, each dashboard would take two to three days. And with every analyst writing their own formulas, the firm risked ending up with thirty subtly different definitions of the same metric. The full case study unpacks the four factors that made a safe migration so hard.
Our Approach
A Migration System, Not More Analysts
Rather than adding headcount, Cognitio Analytics built an AI-assisted migration system around one principle: the machine does the translation and documentation, and the human confirms the intent. The system worked in four moves: Capture, Translate, Confirm Intent and Compound. Every confirmed decision made the next translation more accurate.
Download the case study for the stage-by-stage breakdown.
Evaluation by Design
Accuracy Measured From the First Dashboard
Most teams judge AI output by feel. Cognitio didn’t. From the first dashboard, the firm’s own Tableau experts labelled each translation against ground truth, building a human-verified accuracy record as the work progressed. For an insurer answerable to auditors and state regulators, that record mattered as much as the speed. See how measuring the system and improving it became one and the same in the full case study.
The Impact
Months of Work in Two Weeks, With Every Number Intact
The first dashboard went from upload to reviewed output in under two hours, against a two-to-three-day manual estimate. The full estate of 30+ dashboards was migrated in about 10 working days, with every metric captured as one documented, traceable definition. These are the headline numbers. The full case study has the rest.
Inside the Case Study
What You’ll Find in the Full Story
Download the full case study to explore:
• The four factors that made this migration hard to do safely • How each move in the migration system worked • How expert labelling turned accuracy into an auditable signal • The full set of benefits, from governance over data models to the foundation of a semantic layer
Download the Full Case Study
Get the complete story, methodology, and results.
Explore the Latest
Discover trends and strategies shaping smarter, faster business processes.