How a Top Insurer Moved from Tableau to Sigma in 10 Days Instead of 90
Published Date:
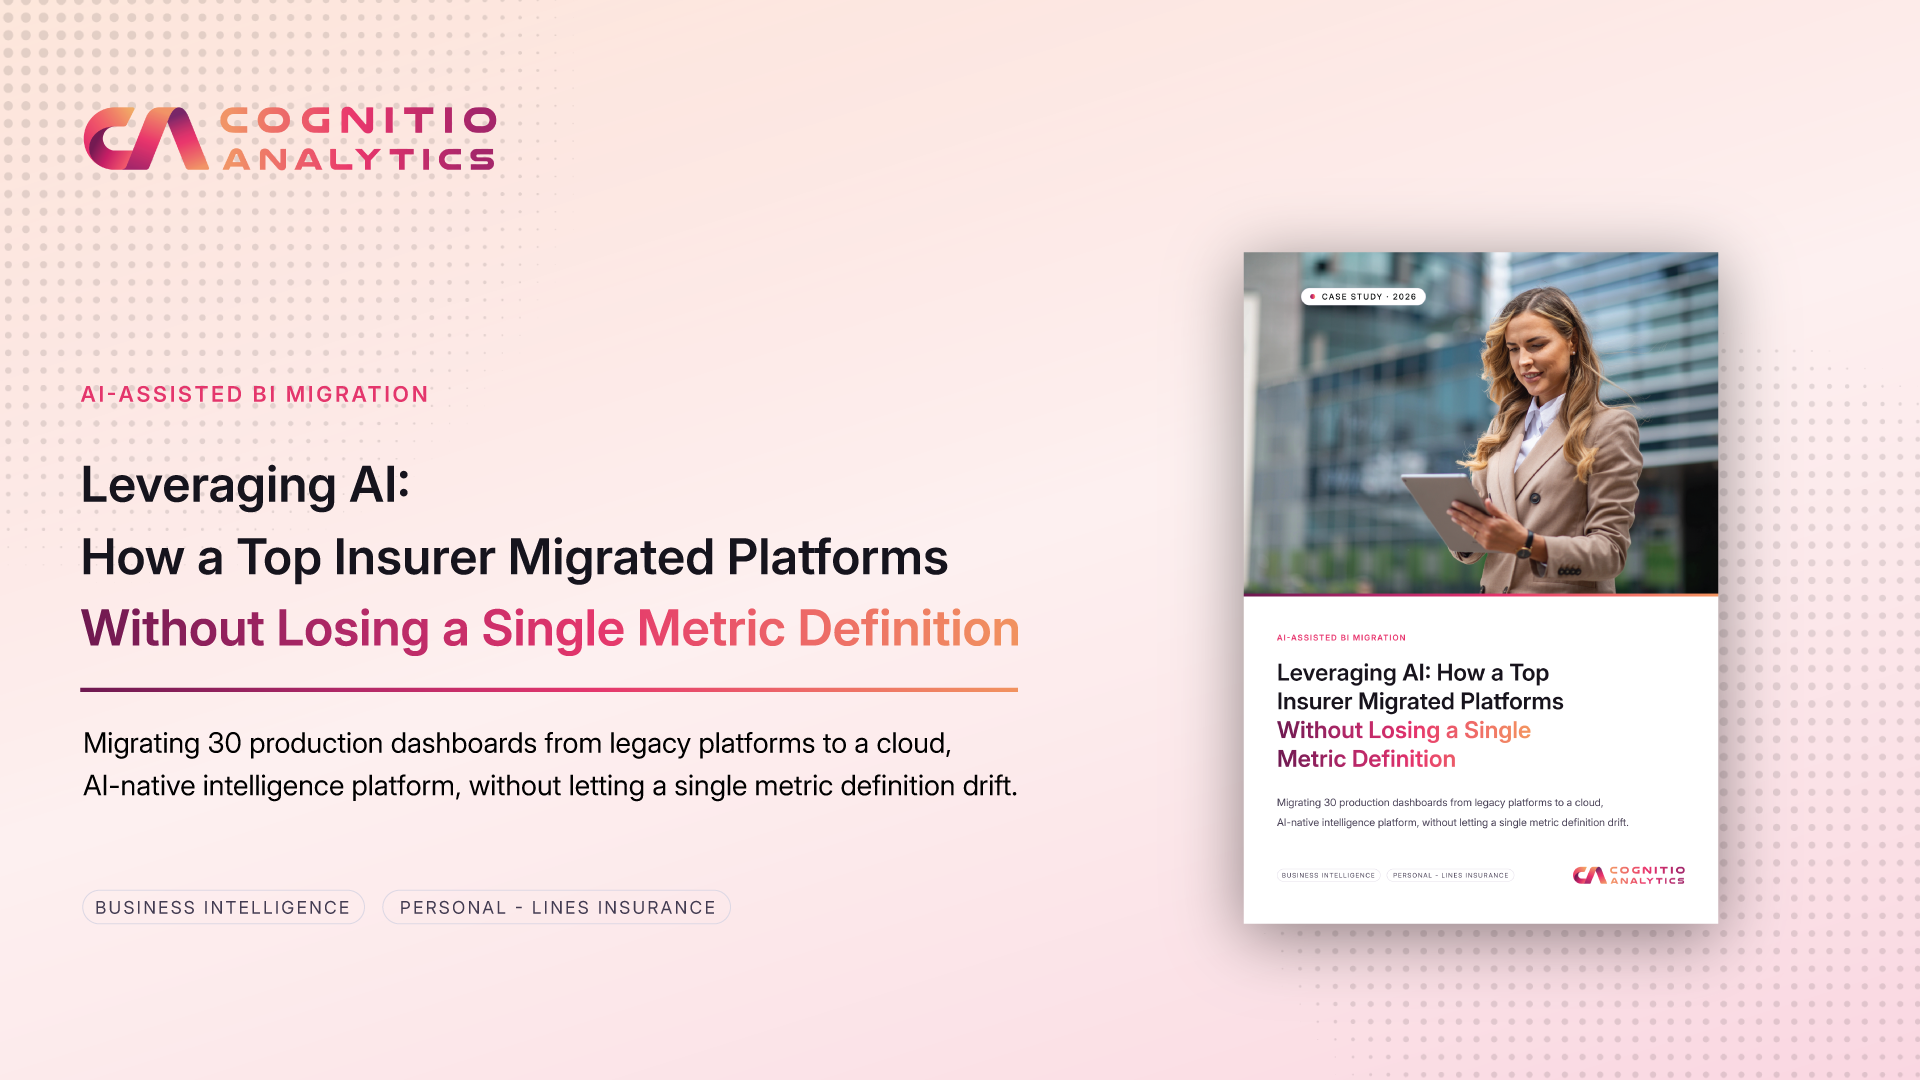
Migrating 30 production dashboards from legacy platforms to a cloud, AI-native Intelligence platform, without letting a single metric definition drift.
A top U.S. personal-lines insurer ran its analytics on Tableau, with more than 30 dashboards tracking policy sales, retention, premium, commissions and producer performance. As the firm moved its data infrastructure to Snowflake, it chose Sigma Computing as its new platform.
Buying the platform was the easy part. Leaders had to trust every number before they could switch. If each dashboard were rebuilt from scratch by a different person, the organization risked ending up with thirty subtly different definitions of the same metric.
Unpacking the Challenge
The real challenge was never the charts. It was the meaning behind them.
The knowledge lived in people’s heads. Formula intent was never written down.
The two platforms don’t speak the same language. Every formula had to be reinterpreted.
Nothing was accumulated. Each dashboard started from zero.
The target kept moving. Sigma shipped new functions throughout the engagement.
Done manually, each dashboard required two to three days. For the full estate, that meant 60 to 90 working days.
See how Cognitio turned each of these four challenges into a design requirement.
Rather than allocating more analysts to the problem, Cognitio Analytics built a migration system around one principle:
The machine does the translation and the documentation. The human confirms the intent. And every confirmed decision makes the next translation more accurate.
What We Did
The system worked in four moves:
1
Capture
Read every workbook; extract every component, full fidelity
2
Translate
Interpret into Sigma against a living reference
3
Confirm Intent
Subject Matter Expert confirms it still means what it should
4
Compound
Every confirmation feeds the next translation
Evaluation by Design
Accuracy was not checked at the end. It was measured from the first dashboard, with Tableau experts labeling every translation as confirmed or corrected. The result was a migration the insurer could stand behind in an audit.
The Benefits
~95%
Faster per dashboard
2–3 days → under 2 hours
100%
Component coverage
All types, incl. LOD & table calcs
60–90 → 10
Working days (30+ dashboards)
Months of work → two weeks
The firm set out to migrate 30 dashboards. What it gained was a single, trusted definition of every number behind them: the one thing a rebuild from scratch would have destroyed.
See how the full migration came together
Get the complete story: the four-step system, the evaluation approach, and the path to a governed semantic layer.